Bugs don’t impress CFOs and CEOs. Revenue saved does.
Why Executives Don’t See the Value of Testing
Ask any CFO or CEO what excites them more: “We achieved 90% test coverage” or “We saved $2.5M in customer churn last quarter”?
The answer is obvious. The language of executives is revenue, cost, and risk. Yet too often, QE leaders talk in technical shorthand—defect density, code coverage, test cycle times. These are real achievements, but they rarely resonate in the boardroom.
The gap isn’t in the work itself. It’s in translation. Executives know quality matters. What they don’t know is how to connect testing, testing outcomes to business and financial impacts. If QE leaders fail to bridge that gap, testing gets seen as a cost center rather than a value driver.
But how QE leaders can reframe our results, build dashboards that speak executive language, and ultimately show that testing is a revenue shield instead of an overhead?
From Technical Metrics to Business Metrics
Traditional QE dashboards are packed with charts:
- Number of defects opened and closed
- Test execution rates
- Coverage percentages
- Bug severity trends
And all that. To engineers, these metrics paint a clear picture. But to executives, they look like noise. The real question in their mind is: What does this mean for our customers, our reputation, and our bottom line?
The pivot QE leaders must master is : translate engineering metrics into business outcomes.
- Defects prevented → Downtime avoided. Each critical defect avoided means hours of downtime and/or feature unavailability not experienced by customers. That downtime has a measurable revenue impact.
- Defect leakage reduced → Churn avoided. Customer churn has a direct revenue cost. If QE finds issues earlier, fewer users abandon the product.
- Cycle time improved → Faster time-to-market. Accelerating releases means faster revenue realization.
- Automation efficiency → Cost avoided. Every hour of repetitive manual testing saved through automation means budget protected.
When reframed in the business way, QE doesn’t just ensure product quality, it clearly ensures business quality.

The “Rework Cost Avoided” Story
One of the strongest ways QE leaders can frame impact is through rework cost avoidance, meaning, the money saved by catching issues early instead of fixing them in production.
This isn’t just a nice theory; it’s backed by decades of industry studies. The U.S. National Institute of Standards and Technology (NIST) has shown that the cost of fixing defects multiplies dramatically the later they are found.: A defect resolved during requirements might cost 1×, at coding 5×, at system test 10–15×, and in production up to 30× more! NASA’s own analysis of error cost escalation confirms the same pattern: Late fixes are exponentially more expensive than early ones .
That’s the math QE leaders should bring to the table. Instead of saying:
“We prevented 50 high-severity bugs from reaching production,”
say:
“By preventing those 50 issues from escaping, we avoided up to 20× rework cost multipliers—translating into hundreds of thousands of dollars in savings this quarter.”
The exact dollar figure will depend on each organization’s own labor rates and historical incident costs, but the direction is unarguable: every bug caught earlier equals real dollars saved later. When framed in these business terms, “rework cost avoided” becomes a narrative executives can instantly understand, because it links quality not to bug counts, but to money protected.
And, that’s the kind of math executives remember.

Dashboards That Speak the Language of Executives
Executives don’t need to see defect counts. They need dashboards that connect QE to outcomes that matter to them.
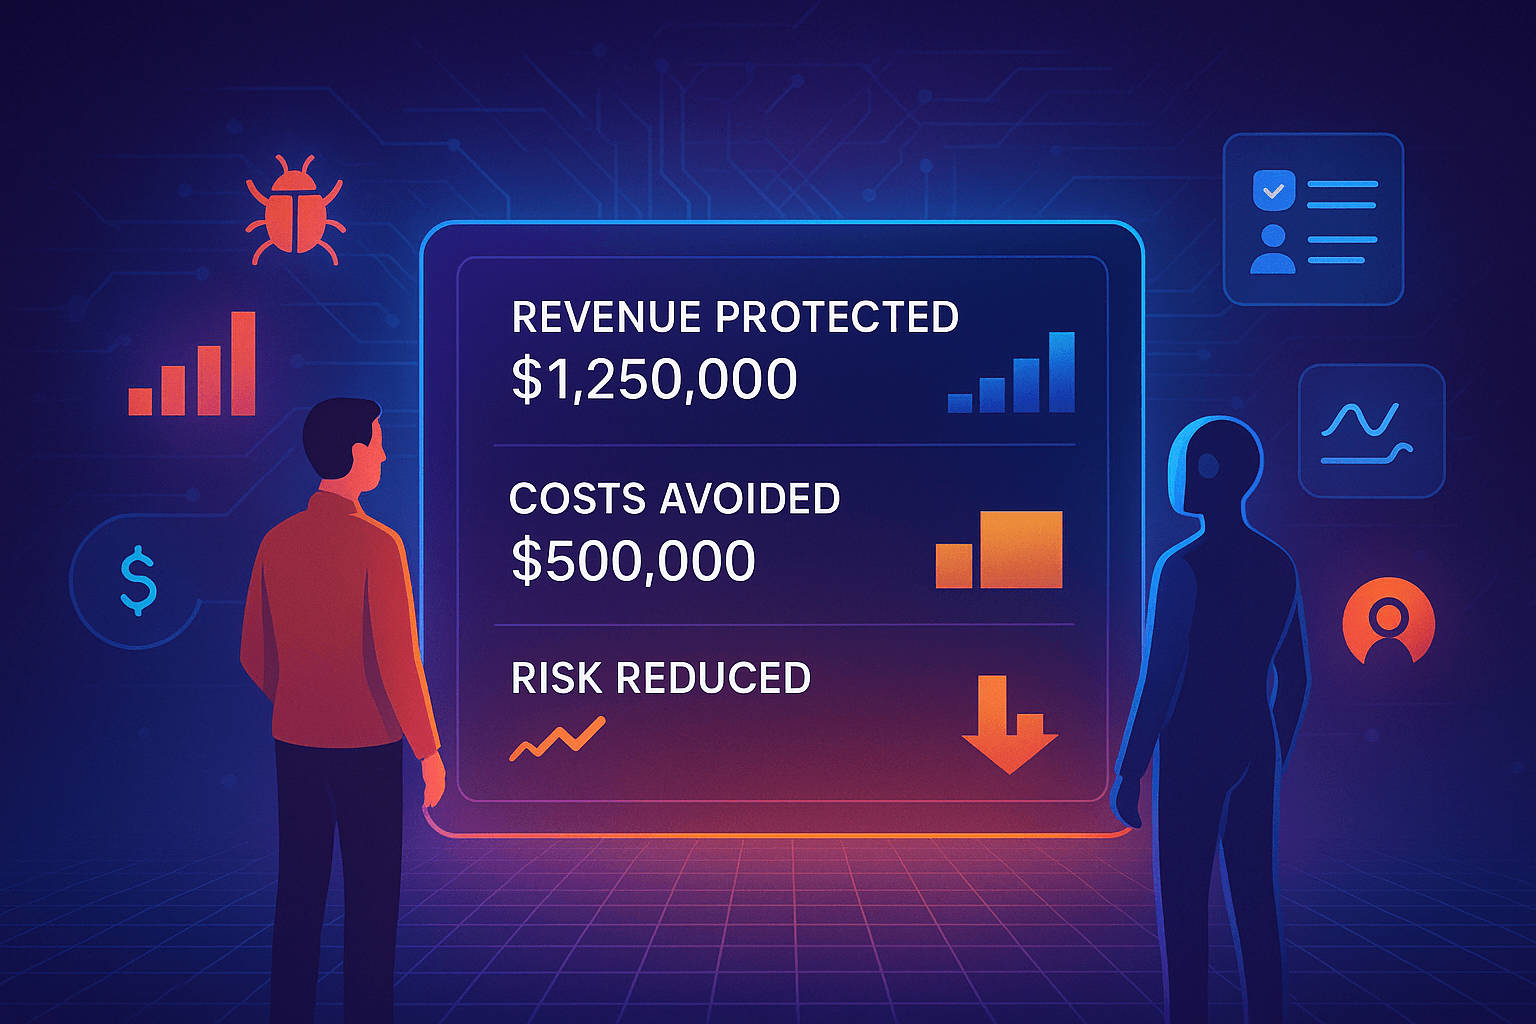
Executive-ready Quality dashboards should focus on:
- Revenue at Risk Avoided
- Quantify churn prevented
- Highlight uptime maintained
- Show financial equivalent of avoided SLA penalties
- Operational Cost Avoided
- Rework savings (bugs found pre-release)
- Test automation ROI (manual effort reduced)
- Support call volume reduced due to higher quality
- Time-to-Market Gains
- Weeks saved in release timelines
- Faster customer onboarding
- Competitive advantage captured
- Risk Mitigation
- Fewer compliance issues
- Lower probability of security breaches
- Regulatory fines avoided
This shift doesn’t erase technical metrics, instead, it reframes them. Beneath every business KPI is a foundation of technical QE data. The genius lies in connecting the two.

Omniit.ai: Turning Signals Into ROI Narratives
Most QE teams already generate mountains of technical data such as test failures, bug reports, uptime logs, and etc. What’s missing is the translation into business outcomes executives care about. That’s where Omniit.ai’s consulting service specifically helps.
Omniit.ai works with client team individually to connect raw QE signals to revenue protection, cost avoidance, and risk reduction. Instead of defect counts, you’ll present stories like:
- “This quarter, automation stabilized 200 flaky tests → saving 120 manual hours and $75K in costs.”
- “Catching 25 production-bound defects early protected $400K in rework cost.”
With this translation, you’re not just showing metrics, you’re proving ROI with executive-ready narratives that earn investment and elevate QE to a business strategy.
Making Quality a Business Strategy
When QE leaders prove ROI in executive terms, testing stops being “insurance” and starts being strategy.
- Quality as cost shield. Every defect prevented is money protected from rework, churn, or SLA penalties.
- Quality as revenue accelerator. Faster releases and better customer experience translate into quicker revenue.
- Quality as risk control. Strong QE practices reduce financial, reputational, and compliance risks.
Executives want to know: “If I invest $1 in QE, what do I get back?” With the right metrics and dashboards, the answer can be precise: “$5 saved in avoided costs, $3 gained in accelerated revenue, and risk exposure cut in half.”
That’s how QE leaders stop asking for budget—and start commanding investment.
Practical Playbook: Proving ROI to Executives
If you’re a QE leader preparing to present to executives, here’s a practical framework:
- Start With Business Stakes.
Don’t lead with coverage percentages. Lead with what executives care about—customer retention, revenue acceleration, risk mitigation. - Quantify Avoided Costs.
Use benchmarks (e.g., cost of defect by stage) and apply them to your actual results. Put dollar signs on quality wins. - Use Executive Dashboards.
Build dashboards that abstract technical details into outcomes: money saved, revenue gained, risk reduced. - Tell Stories, Not Just Stats.
Frame QE’s role in real customer terms. Example: “This defect would have triggered 10,000 failed transactions. By catching it pre-release, we avoided both churn and reputation damage.” - Leverage AI-Driven Translation.
Tools like Omniit.ai automate the conversion of raw signals into business metrics, ensuring consistency and clarity in reporting. - Close With Impact.
Every executive update should end with a bottom-line takeaway: “This quarter, our QE efforts protected $2.8M in revenue and accelerated $1.5M in new customer growth.”
The Outcome
Keep practicing. When QE leaders adopt this approach, they achieve two powerful outcomes:
- Executives see testing as ROI, not overhead. QE leaders stop defending budgets and start earning investment.
- Quality becomes a lever for business growth. QE isn’t just about avoiding bugs—it’s about accelerating competitive advantage, protecting revenue, and shaping customer trust.
This is the hidden ROI of testing. It was always there. QE leaders just needed the right language and tools to make it visible.